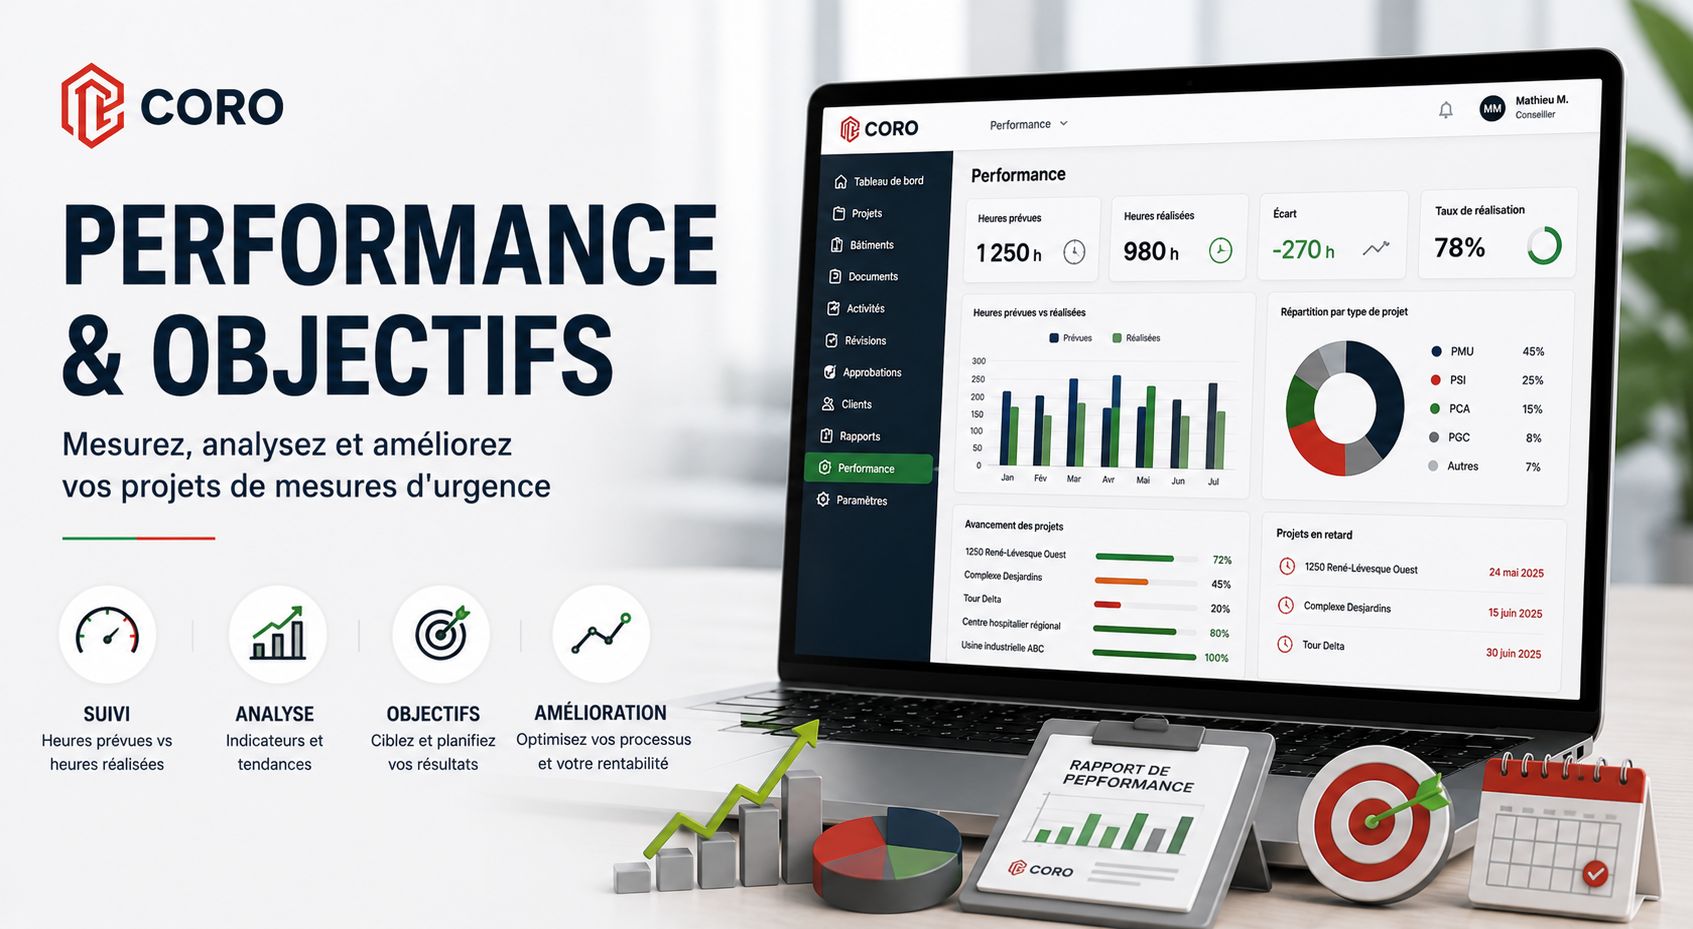
A project can be delivered on time, satisfy the client and still consume significantly more resources than expected. Conversely, a project may have used a large portion of its planned hours while being nearly complete and remain perfectly under control. Understanding true operational performance therefore requires more than one number. Planned hours, actual hours, progress, deadlines, team capacity and objectives must be considered together.
Managing a Project and Measuring Its Performance Are Two Different Things
In our article on managing emergency management projects and mandates , we explained why activities, responsibilities, deadlines and hours should be structured throughout the project lifecycle.
Those data points first help teams complete the work. Once consolidated and compared, however, they serve another purpose: they become management information.
Performance therefore begins with a simple question: does what we originally planned reflect what is actually happening?
Why Hours Alone Do Not Tell the Whole Story
One of the most commonly monitored indicators in a professional services organization is the number of hours spent on a project.
That information is useful, but by itself it does not establish whether a project is performing well or poorly.
Consider a mandate for which 30 hours were originally planned.
At first glance, 80% of the planned hours have been consumed.
That information becomes meaningful only when compared with the actual progress of the work.
If the project is 90% complete, the situation may be perfectly healthy. If it is only 55% complete, the same number suggests that a significant variance may be developing.
A single KPI describes a situation. Multiple indicators viewed together begin to explain it.
Systematically Compare Planned and Actual Hours
Planned-versus-actual tracking is one of the simplest ways to identify project variance early.
When a project is estimated at 25, 30 or 50 hours, that number represents an initial production assumption. Time tracking then shows how much of that resource has actually been consumed.
The objective should not simply be to discover an overrun once the project has already been completed.
It is far more useful to identify the trend while options are still available:
- reassess the remaining activities;
- clarify the project scope with the client;
- reassign certain tasks;
- identify a technical difficulty;
- revise future estimates for similar projects;
- understand why the original estimate differs from reality.
Profitability and Time Consumption Are Not the Same Thing
It can be tempting to automatically treat every hour overrun as an unprofitable project.
The reality is more nuanced.
Profitability may depend on the billing model, selling price, actual cost of the resources involved, project-related expenses and broader commercial considerations.
Hours should therefore first be considered an operational indicator.
When combined with the financial data associated with the project, they can then contribute to a more complete profitability analysis.
An hour overrun is a signal, not automatically a diagnosis. The reason behind the variance must be understood before drawing a conclusion about the project's true performance.
Which KPIs Should Be Used to Manage Professional Projects?
An effective dashboard does not need dozens of different metrics.
A small number of well-selected indicators can already provide valuable operational insight.
| Indicator | What it helps you understand |
|---|---|
| Planned hours | The resources initially estimated to complete the project. |
| Actual hours | The resources that have actually been consumed to date. |
| Project progress | The actual level of completion of the project or its activities. |
| Deadline performance | The team's ability to complete projects within expected timelines. |
| Workload | The amount of work currently assigned to team members. |
| Available capacity | The ability to absorb new work without creating overload. |
| Objectives | Progress toward the targets established for the team or organization. |
Move From Individual Projects to an Organization-Wide View
The performance of an individual project matters, but a professional services organization rarely operates with only one project at a time.
When a portfolio contains dozens or hundreds of mandates, the real challenge becomes understanding what is happening across the organization.
A consolidated view can help identify:
- projects staying within planned hours;
- projects showing significant variances;
- teams or periods experiencing overload;
- document types requiring more resources;
- deadlines likely to create bottlenecks;
- available capacity for new projects.
This moves the organization from project-by-project monitoring toward genuine operational management.
Capacity Planning: Understanding What the Team Can Actually Absorb
One question comes up regularly in professional services organizations:
“Do we have the capacity to take on more projects?”
Ideally, the answer should not rely only on intuition.
A consultant may appear available while having several major deadlines concentrated within the same few weeks. Conversely, a team that looks extremely busy today may have substantial capacity available later in the month.
Capacity planning brings together:
- projects already assigned;
- remaining activities;
- planned hours;
- deadlines;
- resource availability;
- expected future projects.
Capacity is not simply the number of open hours in a week. It must be assessed in relation to existing commitments and upcoming deadlines.
Allocate Work According to Actual Capacity
Better visibility into team workload can also improve the assignment of new projects.
Without consolidated information, it is easy to repeatedly assign new mandates to the same people or discover too late that a consultant is already overloaded.
Capacity visibility supports better questions:
- Who actually has availability?
- Who is approaching a critical workload period?
- Which consultant has the required expertise?
- Can certain activities be reassigned?
- Should the start of a new project be delayed?
Measure Individual Performance Without Reducing People to a Number
Performance data can also be viewed at the individual consultant level.
Depending on the organization's configuration, relevant indicators can include completed mandates, recorded hours, deadline performance and document quality.
These data can help managers understand how the team operates, but they must always be interpreted within context.
Two consultants may show very different output levels simply because they are working on projects of very different complexity.
A KPI should start a discussion, not replace analysis. A variance may indicate a process problem, an inaccurate estimate, an unusually complex project or a need for additional support.
Performance Data Should Improve the Production System
The purpose of a performance dashboard should not be to reduce every consultant to a set of statistics.
Data become particularly valuable when they help explain why certain situations occur repeatedly.
For example, if one type of project consistently exceeds its planned hours, several explanations may be possible:
- initial estimates are too low;
- the production process involves too much manual work;
- client information arrives too late;
- the documents involved are more complex than expected;
- the commercial scope does not match the work actually required;
- one workflow step repeatedly creates delays.
In that context, data are not simply being used to evaluate an individual. They help improve the way the organization operates.
Set Objectives That Can Actually Be Monitored
An organization can establish monthly, quarterly or annual objectives.
To be useful, those objectives should ideally be linked to data the team can actually measure.
Examples may include:
Production
Number of mandates or documents completed during a given period.
Deadlines
Percentage of projects delivered according to planned timelines.
Hours
Comparison between planned and actual hours across projects.
Capacity
Current and projected utilization and availability of the team.
CORO's Performance & Objectives environment is designed to connect operational project data with performance indicators and measurable targets.
Useful Objectives Should Lead to Decisions
An objective provides little value if it is simply displayed on a dashboard.
It becomes useful when a variance leads to analysis or action.
For example:
- capacity is too low → reconsider project allocation;
- hours repeatedly exceed estimates → review project assumptions;
- deadlines are frequently missed → identify recurring bottlenecks;
- a project type consumes excessive resources → review the process or pricing;
- the team has unused capacity → consider accelerating new project assignments.
Turn Operational Data Into Management Decisions
The value of performance data comes primarily from making operations more visible.
When an organization can connect hours, budgets, projects, deadlines and resources, it gains a stronger foundation for decision-making.
The dashboard is therefore not the end goal.
Its role is to make the few situations that actually require managerial attention easier to identify.
How CORO Connects Project Management With Performance
CORO uses data generated during everyday project work to create a broader view of operations.
The Project & Mandate Management environment structures activities, responsibilities, deadlines and hours.
The Performance & Objectives environment can then use that information to support variance tracking, workload visibility, capacity planning and organizational objectives.
The goal is to avoid treating project management and performance analysis as two completely separate processes.
From Project Performance to Organizational Performance
The model becomes particularly valuable when several operational cycles are connected.
The more structured the data are at the source, the less time is required to rebuild management reports manually from separate systems.
Performance management can then become a natural extension of the work already being completed rather than an administrative exercise performed afterward.
Measuring More Does Not Necessarily Mean Managing Better
It is possible to create dashboards containing dozens or even hundreds of indicators.
That does not necessarily lead to better decisions.
In a professional services organization, some of the most useful indicators are those that help answer a few essential questions quickly:
- Are we staying within planned hours?
- Are we meeting deadlines?
- Where are significant variances appearing?
- Who is overloaded?
- Where do we still have capacity?
- Can we accept additional work?
- Are we achieving the objectives we established?
The purpose of a good KPI is not to provide every answer. It is to show where the right questions need to be asked.
FAQ — Project Performance and Profitability
How do you determine whether a project is profitable?
Profitability depends on factors such as project revenue, resource costs and other expenses. Planned and actual hours are important operational indicators, but they should be combined with the relevant financial data to determine true project profitability.
Why compare actual hours with project progress?
Because the same level of hour consumption can represent very different situations depending on project completion. Using 80% of planned hours when a project is 90% complete is very different from using 80% when only half the project has been completed.
What is capacity planning?
Capacity planning compares current and projected workload with the actual availability of team members so that new projects can be assigned more effectively.
Which KPIs are useful for professional services firms?
Useful indicators may include planned and actual hours, project progress, deadline performance, workload per consultant, available capacity and progress toward defined objectives.
Should KPIs be used to evaluate employees?
They can contribute to understanding individual results, but they should always be interpreted in context. Their greater value often lies in identifying variances, process issues, support needs or differences in project complexity.
Why integrate performance data with project management software?
When hours, activities, deadlines and projects are already captured within the same environment, those data can be used directly to generate useful performance indicators without manually rebuilding the information in separate tools.
Manage Performance With CORO
Turn the operational data generated by your projects into useful information for tracking hours, budgets, variances, team capacity and organizational objectives.
Discover Performance & Objectives